 Oshili Power
More than five hundred days without load shedding. An energy availability factor of 65 per cent, the best in six years. A diesel bill down by four fifths. A utility that now says, for the first time in ten years, that it has two to three gigawatts to spare. Calm has a price, and the price of calm is that nobody is buying insurance. That is the moment a market chooses to put a number on it.
What the quiet is made of
It is worth being precise about where the stability has come from, because the answer decides who is carrying the risk. It has come from a coal fleet that has been nursed back to 65 per cent availability, from a utility that paid for peaking diesel out of its own account when the fleet fell short, and from nine gigawatts of rooftop solar that took the midday load off the system without anybody signing a contract for it. In each case the cost of firmness was carried by someone other than the industrial buyer, and it arrived in the buyer's price as an average rather than as a line.
That arrangement is ending by design, not by accident. The transmission company now trades in its own name. The wholesale market has a licensed operator. The first determination under the new resource plan puts storage and gas ahead of wind and solar, which is a statement about which hours the planners are worried about. Each of these is a step towards a system in which the hours the sun does not cover carry their own price, paid by whoever is exposed to them. The policy question of whether to do that has been answered. The commercial question of who pays is open, and most contracts in force today were written before it was asked.
The rooftop plateau and why it matters more than it looks
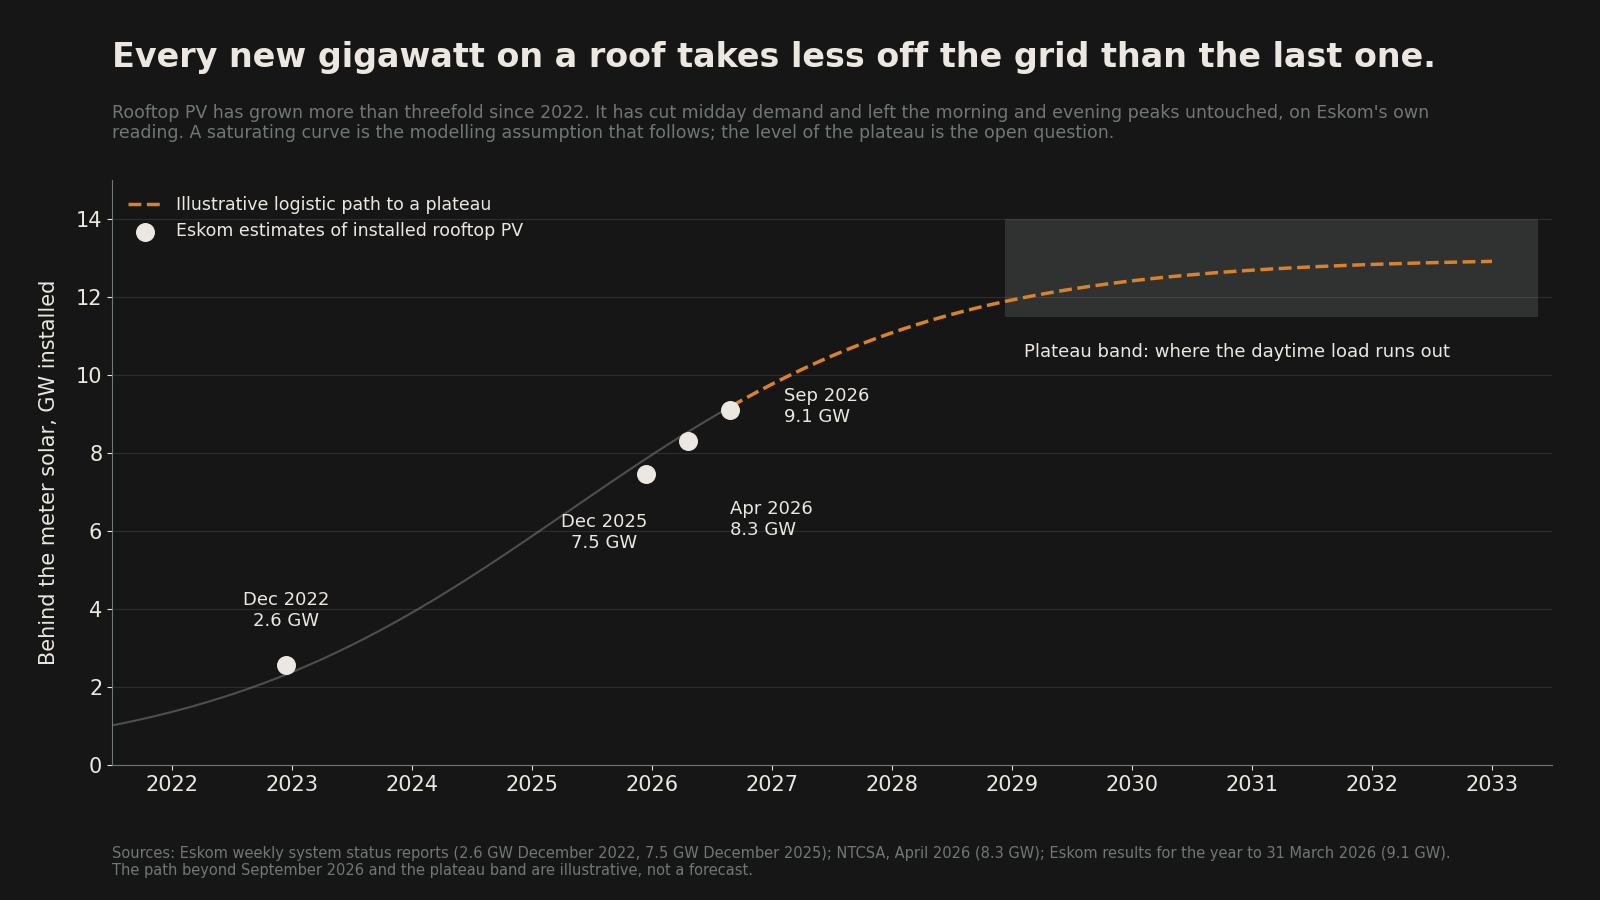
Behind the meter solar in South Africa has grown from 2.6 gigawatts at the end of 2022 to 9.1 gigawatts on Eskom's latest count, more than threefold in under four years. Eskom's own reading of the effect is the important part: rooftop PV has reduced demand on the grid in the middle of the day and has not reduced it at all over the morning and evening peaks. The coal fleet still has to be there at seven in the evening, and it still takes many hours to bring back if it is not.
Growth of that kind does not continue in a straight line, and the way it slows is the thing to model rather than the headline. Rooftop solar competes for the same hours on every roof it lands on, so each new gigawatt displaces less grid energy than the one before it. Once the daytime load of the commercial and industrial sites that can host it is covered, the midday effect saturates. The modelling assumption that follows is a curve that flattens, and the consequence that follows from the curve is the one buyers should notice: the shape of the problem is now stable. The evening ramp is no longer getting shallower, the midday trough is no longer getting deeper, and the hours that need firm supply are a fixed feature of the system for the next decade, not a transition that will pass.
How we built a view we could be wrong about
A forming market has no price history to lean on, so we built one the way the forming years of other markets teach. Ireland rebuilt its market in 2018 with an explicit price for scarcity and a capacity auction beside the energy price, and its early years showed that the price of being available moves to wherever the rules put it, quickly, and before most contracts have been rewritten. South Australia is the other lesson: a decade of rising solar in which the annual average price hid almost everything the evening was doing. Both taught us the same thing. The average is the least informative number a market produces, and the question is always what the tail is doing.
So the model clears a merit order hour by hour across twenty one weather years at forty four wind and solar sites and ten load centres, with stochastic outages drawn against a coal fleet whose availability declines over time, a scarcity curve, the market price cap, and four regulatory worlds for how the cap and a capacity mechanism might evolve, each weighted. Two hundred draws give a distribution of annual prices for every year of the first two decades of trading. Before we read a number from it we tested it, once, against the observed prices of a formed market with the same engine, with no refit allowed afterwards. The tails matched. The middle of the distribution did not, and it is read with that bias disclosed: where the fan is wrong, it is calmer than the real history of the market we tested it on, so the spread below is more likely understated than overstated.
What the first six years look like
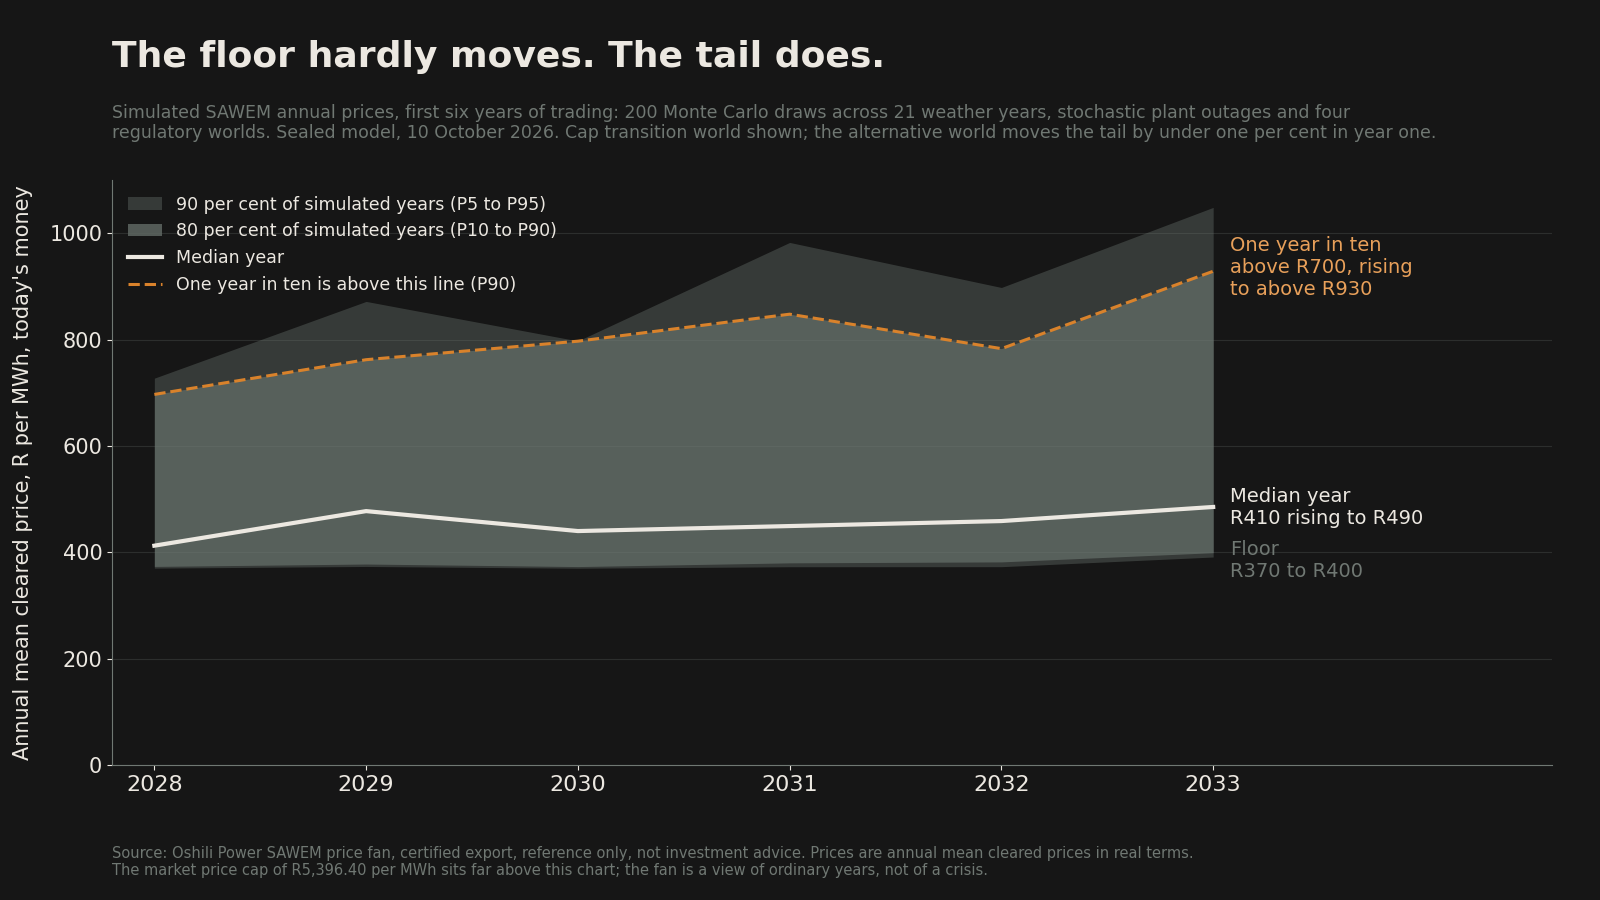
The model runs for twenty years of trading, from 2028 to 2047; the first six are shown here because they are the years in which a contract negotiated now will be priced. In the first year of trading the median simulated year clears at roughly R410 per megawatt hour in today's money, with a floor close to R370 and one year in ten above R700. Over the five years that follow the median rises to roughly R490, which is a rise of a fifth. The one in ten year rises from about R700 to about R930, a rise of a third, and the one in twenty year approaches R1,050. The floor barely moves at all.
Read that shape rather than the level. A buyer whose budget carries the median is exposed to a distribution whose upside is growing faster than its centre, and the upside is not evenly spread across the day; it lives in the hours that rooftop solar cannot touch. Nothing in the fan is a crisis. The market price cap of R5,396.40 per megawatt hour sits far above the chart, and the fan describes ordinary years. That is the point: in ordinary years, the premium for the hours the sun does not cover is already the fastest growing line in the distribution.
Three ways this is wrong
A forecast that cannot say how it fails is not a forecast. The first way is the rules: if the cap and the capacity arrangements evolve differently from the four worlds we weighted, the tail moves, and it moves first. The second is coal: if the fleet holds 65 per cent availability for longer than the declining path we assume, the floor holds and the tail thins. The third is demand: if industrial load keeps leaving the grid at the rate of the last financial year, there is less scarcity to price and the whole fan sits lower. Each of these has a direction, and in each case the buyer who has asked the question in advance is better placed than the buyer who has not.
The question for your contract
For a large power user the useful questions are narrow. Which price does your supply agreement reference once a wholesale market is live, and who chose it. What happens to your evening block if the reference price starts to carry a scarcity component, and whether that is passed through, capped or simply absorbed by the other side. And who in your organisation owns the number in the budget, and whether they have seen the distribution it was drawn from.
We can share the method note behind the fan, with the construct, the test and the three failure modes set out in full. If that is useful, message the page.